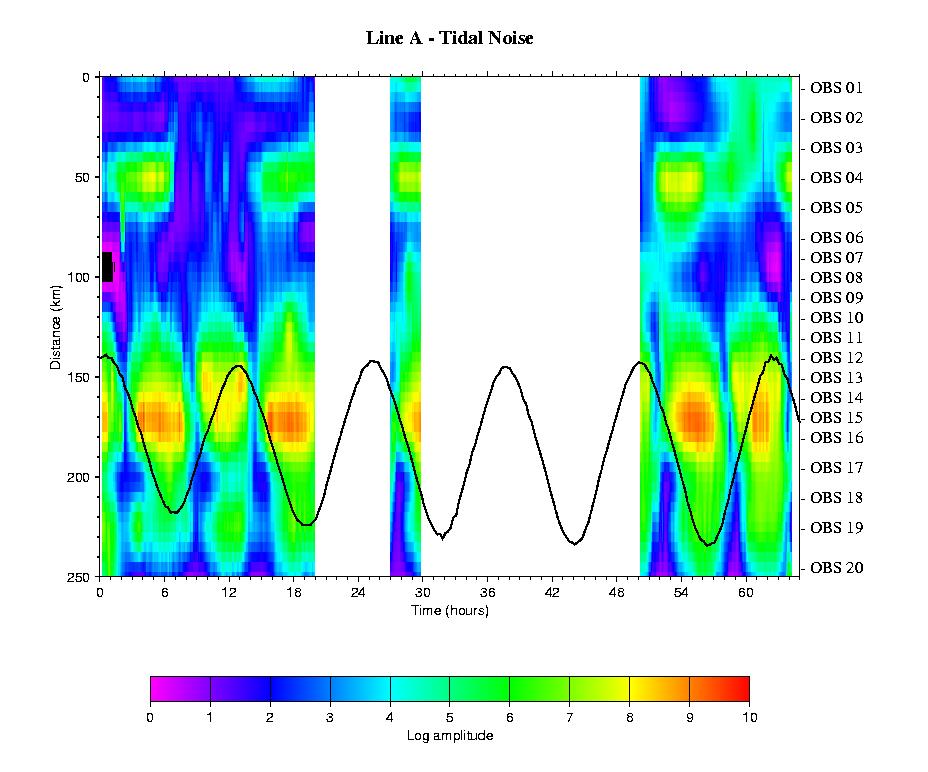
Record sections from OBS located in shallow water on the Shetland
Platform show
alternating bands of noisy and clean data. Plotting the mean amplitude
against
shot time for each OBS shows that the bands of noise occurred at the
same time
on different instruments. The figure shows true amplitudes gridded
with respect
to OBS location (kilometers) and time since the first shot (hours,
note there
are two breaks in shooting). The variations in amplitude, where "hot"
colours
represent high amplitudes and therefore more noisy data, are compared
to a curve
of sea-level recorded at Lerwick on the Shetland Islands (black line,
data
provided by the British Oceanographic Data Centre, Bidston). The noisy
portions
of data occur on a 6-hour cycle and are consistent along the whole
length of the
line. These times of increased noise appear to correlate well with
times when
the sea-level was rising or falling. Quieter periods correspond to
either high
or low water. The noise observed on the OBS data is therefore most
likely tidal
in origin. The possibility of tidal noise is an important factor to
be taken
into consideration when planning OBS surveys in shallow water, especially
in
areas of strong tidal streams.